


Adoption Metrics built on AppExchange App Analytics Data
Churning App Analytics logs to reveal usage trends is an intensive process; however, the journey doesn’t end here. It’s still tricky to focus on the right set of metrics as the product grows and features pile up. You need some indicators for the overall health of app usage to optimize the decisions as the product grows and the user base expands.
That’s where “Key Performance Indicators” (KPIs) play a major role, revealing customer behaviour insight beneath the surface of usage patterns. KPIs align reporting to the business and operational goals along different phases of product growth.
We’ve compiled a list of industry-standard KPIs to mark adoption milestones with measurable, tangible metrics.
Breadth and Depth of Adoption
The breadth of adoption measures how much of your users shift to using the product on a regular basis. This helps you understand if your efforts are enough for your target users to realize enough value from your product.
Depth, on the other hand, refers to how many core features of your product have been adopted. You need to understand if the customers are using key features that will make them "sticky.". Better feature engagement will ensure that the users who have “adopted” your product will keep on using it.
Let us create breadth and depth scores using your ISV Insights toolbox.
Creating an Adoption Breadth Score
- Prerequisite: you have already mapped major Salesforce Event onto Features
- Go to KPI Scores > New KPI Score Configuration > Add Rule
- Pick the rule type as ‘Feature Usage’. From the ‘Features’ dropdown, select a core Feature
- From among Target Metrics, select Unique Users % (Relative to Sold Seats). You can also choose the next metric (relative to baseline users) if you have configured the baseline users.
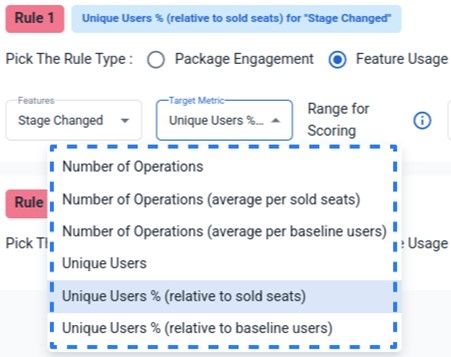
- Keep the thresholds for this metric between 25% and 75%. Adjust this range according to the product’s age and the traction range you expect accordingly
- Repeat the same process for up to 5-6 Major Features
Note: It’s ideal to use the metric “user% of sold seats" only if the majority of your license sizes are 50 or larger. This metric would not give smooth results if most of your licenses fall below ~25 seats or so. In that scenario, it’s ideal to stick to absolute “Unique User” count without any %.
That’s it! This metrics marks Essentially the popularity of your core features, indicating how widespread it is in each Account.
Creating a Adoption Depth Score
- Go to KPI Scores > New KPI Score Configuration > Add Rule
- Choose a feature. This time, use Target Metric as “Number of Operations average per baseline user.”
- To create an adoption depth score, we must keep a lower expectation on minimum frequency. The lower threshold should typically be from 5 to 10 interactions per user per month, and the upper range should be no more than 30. Remember, we are measuring if users are touching all corners of the app at a basic rate.
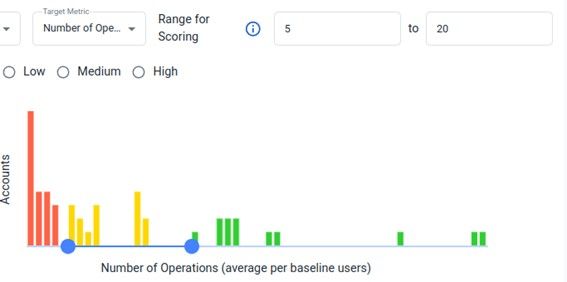
- However, we must throw in a large number of features for this KPI to be useful. This way, the feature will remain low if crucial features remain untouched. Repeat the above process for at least 8 to 10 features. Don’t restrict to the main features. Include a wide variety of features to gauge how well users are venturing through the application.
With these two fundamental KPIs, you are well on the way to ensuring customer success during the adoption phase. Typically, the first mark of successful adoption is a good breadth, followed by a depth score. If the account is stable in a satisfactory range for about 3-4 months, we can target for higher frequency through a frequency score measure.
For a Core Adoption Frequency Score, you simply duplicate the breadth score just created, keeping rules and feature sets the same. Configure the target metric as operation per sold seat. Since the target is a high adoption frequency now, update the lower threshold for high usage frequency: 20 and above per month.
A healthy account journey looks like a steady rise in breadth and depth score, while it’s no bad news if only breadth rises first followed stable depth score. A decrease in any of them is a red alert and must be addressed asap. Once the majority of the account is familiar with the features and your ISV app is a regular part of their workflow, the frequency score also climbs up. You can use these scores as a simple litmus test for your account progress and take necessary corrective actions at respective stages.
Thank you for reading this! We’d love to hear your story of adoption growth with the aid of ISV insights. Kindly reach out to support for any additional queries or feedback.