


Table of contents
Apart from being a threat to growth and goodwill, churn denotes deeper issues like poor product-market fit, inadequate onboarding, or a value gap between the expected value and delivered value.
Thorough Churn analysis, goes beyond fixing customer issues; it brings focus to a customer-centric culture, and delivering consistent value throughout the customer lifecycle.
Appexchange partners can use Salesforce App Analytics, to analyse behaviour of churned accounts and set up a workflow to identify similar patterns. In this article, we use ISV Insights to help AppExchange ISVs :
- Find Churn indicators using past churn analysis
- Design KPI based on analysis & set custom thresholds
- Segment churn insights and enable notifications
Pre-requisites: It's preferred that you have mapped custom entities onto feature buckets with feature manager. You ideally need 6 months+ of logs data. If the
Step 1. Observing patterns of Churned accounts
Navigate to Accounts Page > Choose Account Status as “Churned”. You may choose a data window to narrow down churns from a specific period.
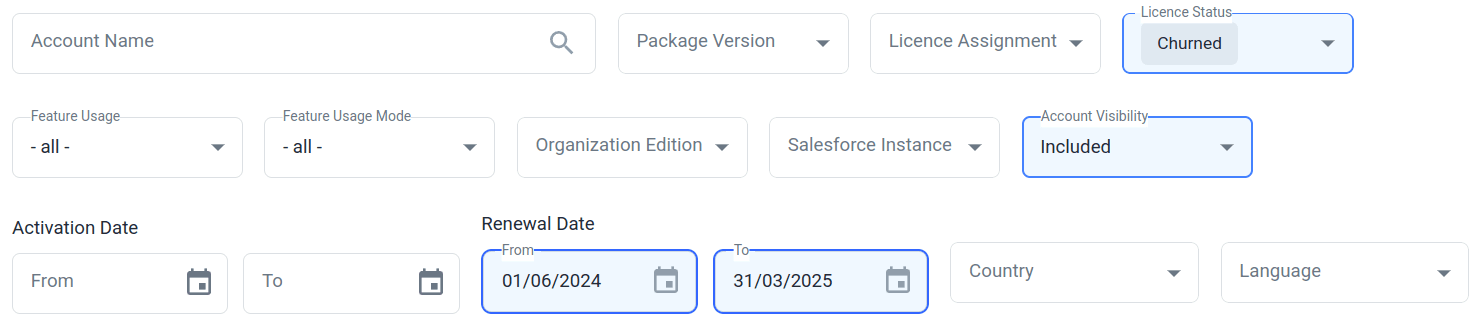 Here we chose accounts churned within past 3 quarters.
Let’s analyze key feature usage for these accounts. Click open one of the churned accounts and scroll to “Pinned Features”.
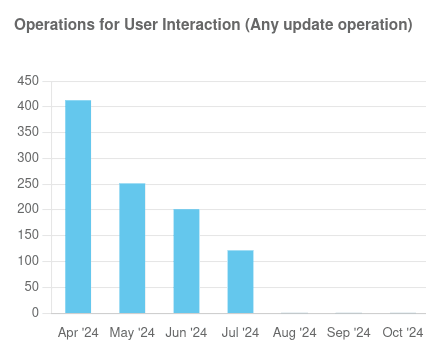 This is Account data for one of our AppExchange Partners – showing churn in July 2024. A clear rop off in two key features following the churn.
Luckily, similar pattern was observed for other accounts as well! This allows us to set a premise for Churn prediction. There may be other patterns, like a steady and low count of operations, instead of the fall we saw here.
Note : Operations per is better compared to absolute operations – as it normalizes for account size variation. This parameters needs precaution though, since App Analytics includes non-user interactions (eg. via automations or external forms) - and can throw your prediction off the charts.
Step 2. Setup KPI Scores and Threshold
Let’s build a KPI Score aligned with the patterns observed above.
- Navigate to Setup > Configuration > KPI Scores and Choose a New KPI Score Setup
- Add your first rule. Chosing the Rule type as “Feature Usage”. Select the relevant feature from the dropdown.
 We set Target metric to Number of Operations. We select a expected range at lowest value at 20, and an upper value of 150.
A figure close to lower range indicates potential churn. On the other hand, a movement above the higher value signifies healthy adoption and can be utilized to predicting upsells.
We can add up to 2-3 such rules. If one of these features is more important for your product journey, You can assign it a rule weightage that’s on the higher side.
Please save this KPI, and set it as the Primary KPI Score. W e can detect any sharp falls, before the KPI falls below the level set here. To do so, we must set threshold values. Open configuration menu from Setup: Select “Configure KPI Score Trends” and set Threshold to 10 or above.
Step 3. Segment churn Insights
Bring this analysis to your daily workflow by creating a watchlist
- Click on Advanced filters to reveal all the filters
- Select Score filter at 60 and below. Set KPI Score Trend at declining
- Choose higher seats filter – to dedicate a team towards Key accounts
- You can also segment by geography – here I have selected all EU countries so that the executive for EU can monitor their focus churn list proactively
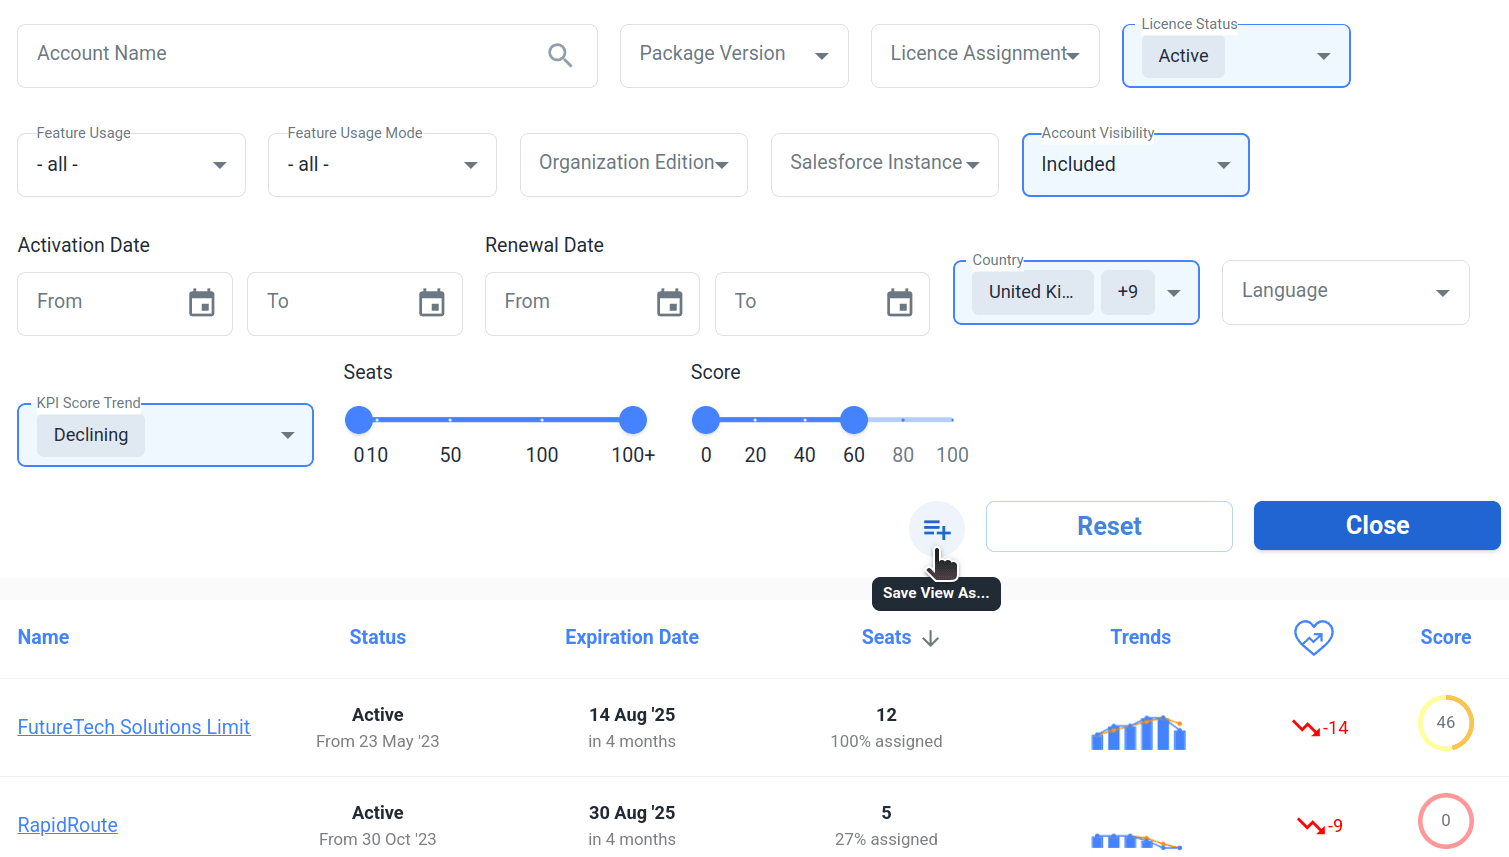 Click on “save view as..” – this will bring the to your regular attention through dashboard notifications.
To summarize :
- Start with analyzing usage counts for the key features. If certain features show clear indication of drop / stagnation before majority of churns, build a KPI using these features.
Set thresholds, and create a custom watchlist to You can play around with the threshold values, start with a small value and slowly raise if you find too many false alarms.
It’s worth it to revisit this setup every 6 months, or with every major upgrade in your features or customer base.
Armed with this data, we have implemented a churn identification strategy. This will help Monitor customer behavior in real-time, identifying early signs of disengagement.
Once you identify any of the signs related to potential churn, we can implement the suitable mitigation strategy whether through personalized onboarding, timely support, or data-driven retention campaigns. Such Churn analysis can help ISV Partners companies build stronger, more loyal customer relationships.